the i wasn’t using my civil rights anyway sales distribution
by now, we’ve all seen the “red vs. blue” state maps, with electoral-vote.com providing what appears to be the most up-to-date state-by-state polling data. so, i thought it’d be interesting to look at the electoral distribution of sales of the “i wasn’t using my civil rights anyway” merchandise, in my personal effort to draw some attention to attorney general ashcroft and his righteous band of lawyers…
so, i thought i’d cook up another bogus election-year map based on my own figures for the popularity of “i wasn’t using my civil rights anyway” merchandise…
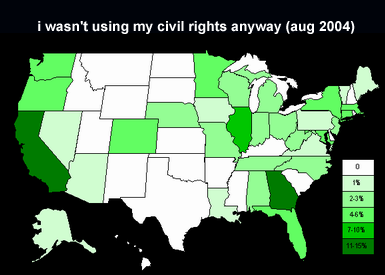
this is based on percentage-of-total-sales data (since that was convenient), so ideally, i’d like to see a a population-density distribution, or maybe even a nice, pale green covering all 50 states (that is, about 2% for each). but, we have some surprises here…. georgia with 15 (very red – 52-41% bush on the last poll) electoral votes is sucking up more than 10% of sales. texas with 34 has no interest in this message at all. i’ll forgive wyoming and rhode island and delaware. interestingly, about 2% of sales are “overseas”1 – canada and the united kingdom.
it might be fun to speculate about this stuff… could it be that there’s an irony deficit in the middle of the country? the south gets it. the west gets it. the northwest gets it. even the industrial midwest gets it, but somehow, with the exception of the hip skiing bunch in colorado and who-knows-what’s-going-on in nebraska, they just don’t get it. or maybe they get it and they don’t like it.
this could be dramatically improved, of course, but i wanted to play around a bit. hope you had fun.
1 in the president bush sense of the word – “Over 50 percent of our energy comes from overseas. Fortunately, a lot of it comes from Canada.” (ontario, california, 2002.01.05)
update (2004.08.16): asheesh had some useful comments, but apparently had trouble making them stick. basically, he’d like to see this map re-cooked on a sales-per-population basis. i think that is definitely the better approach (see “dramatically improved” above), but it meant looking up state populations and doing math, so i didn’t go that far :)… maybe next time