Tuesday, August 17, 2004
Tuesday, August 17, 2004
Saturday, August 14, 2004
the i wasn’t using my civil rights anyway sales distribution
by now, we’ve all seen the “red vs. blue” state maps, with electoral-vote.com providing what appears to be the most up-to-date state-by-state polling data. so, i thought it’d be interesting to look at the electoral distribution of sales of the “i wasn’t using my civil rights anyway” merchandise, in my personal effort to draw some attention to attorney general ashcroft and his righteous band of lawyers…
so, i thought i’d cook up another bogus election-year map based on my own figures for the popularity of “i wasn’t using my civil rights anyway” merchandise…
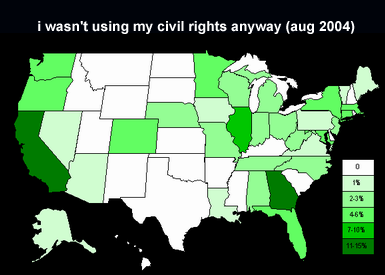
this is based on percentage-of-total-sales data (since that was convenient), so ideally, i’d like to see a a population-density distribution, or maybe even a nice, pale green covering all 50 states (that is, about 2% for each). but, we have some surprises here…. georgia with 15 (very red – 52-41% bush on the last poll) electoral votes is sucking up more than 10% of sales. texas with 34 has no interest in this message at all. i’ll forgive wyoming and rhode island and delaware. interestingly, about 2% of sales are “overseas”1 – canada and the united kingdom.
it might be fun to speculate about this stuff… could it be that there’s an irony deficit in the middle of the country? the south gets it. the west gets it. the northwest gets it. even the industrial midwest gets it, but somehow, with the exception of the hip skiing bunch in colorado and who-knows-what’s-going-on in nebraska, they just don’t get it. or maybe they get it and they don’t like it.
this could be dramatically improved, of course, but i wanted to play around a bit. hope you had fun.
1 in the president bush sense of the word – “Over 50 percent of our energy comes from overseas. Fortunately, a lot of it comes from Canada.” (ontario, california, 2002.01.05)
update (2004.08.16): asheesh had some useful comments, but apparently had trouble making them stick. basically, he’d like to see this map re-cooked on a sales-per-population basis. i think that is definitely the better approach (see “dramatically improved” above), but it meant looking up state populations and doing math, so i didn’t go that far :)… maybe next time
Saturday, August 14, 2004
Saturday, August 14, 2004
service to society
i saw this tonight, and i think there’s something worth echoing in my own little chamber…
Probably, however, the principal objection of the honourable professions to advertisement is neither the fact that is misleads the ignorant nor that it is an unfair method of competition, but the indication it affords of a character who is more concerned with exploiting the profession for his own personal advantage than with the service to be rendered to society.
which begs the question… are there no “honourable professions” left, or has the concept of service to society collapsed like so many other quaint concepts?
Saturday, August 14, 2004
Saturday, August 14, 2004
Saturday, August 14, 2004
Friday, August 13, 2004
Friday, August 13, 2004
benefit and burden of the bush tax cuts
with data from a reuters story about a to-be-released-today (and hence not yet linkable) congressional budget office report, i thought i’d take a moment to put some numbers together… the various reports give us some benchmarks… but no real comperable data. since i barely touch this economics stuff (i have friends to do the heavy lifting on this subject), i just want to make some quick observations and see what develops.
The report said the top 1 percent, with incomes averaging $1.2 million per year, will receive an average $78,460 tax cut this year, and have seen their share of the total tax burden fall roughly 2 percentage points to 20.1 percent, according to The New York Times.
In contrast, households in the middle 20 percent, with incomes averaging $57,000 per year, will receive an average cut of only $1,090, the newspaper said, citing the CBO report.
Taxpayers whose incomes range from $51,500 to around $75,600, saw their share of federal tax payments increase, according to CBO figures cited by The Washington Post.
…
The newspapers, citing the CBO report, said about two-thirds of the benefits from the cuts went to households in the top 20 percent, with an average income of $203,740.
People in the lowest 20 percent of earnings, which averaged $16,620, saw their effective tax rate fall to 5.2 percent from 6.7 percent, though their average tax cut was only $250.
the republican spin on this, predictably enough, is that we’re all better off now:
Report Finds Tax Cuts Heavily Favor the Wealthy [new york times, august 13, 2004]“It doesn’t matter who you are, the report shows that you are better off now than you were before the tax cuts,” said a House Republican aide. “It’s showing that everybody’s tax burden has gone down as a result of the tax cuts.”
unless, of course, you fall into that $51,500-$75,600 band (but that’s nit-picking). there’s a bigger picture here (and that’s barry’s cue). most things in economics only really matter in relative terms – it’s not about how much a loaf of bread costs in dollars-and-cents, it’s about how much a loaf of bread costs compared to how much you earn. it’s not about how much you earn, it’s about how much you earn relative to how much it costs to keep that job. so i want to hook up two “bigger picture” thoughts to these tax-cut figures: debt and poverty.
one thing that’s not included is the other side of the coin (so to speak) – the national debt, which, by my rough calculations ($7,330,000,000,000.00 / 294,000,000), is just a little less than $25,000 per person. now that i’ve got that benchmark number, i’m going to play fast and lose with the data, because it seems that everyone else is anyway. the first thing i’m going to do is multiply the $25,000 individual debt figure by 2.5 average individuals per household to come up with a $62,500 national-debt-per-household figure so i can compare it to income per household.
$62,500 is just a wee bit more ($5,500 more) than the average income of the middle quintile of american households. so, if you just give back your tax cuts, for the middle quintile’s tax cut of $1090, they’re only $61,410 behind on their “share” of the national debt. the bottom quintile’s $250 tax break puts them only $62,250 behind on their “share.”
so, for you low-to-middle-income households, enjoy your tax cuts, because you need to work extra hard to get us back into the black. if you’re in the bottom quintile, you need to work about 45 months to earn enough money to pay off your chunk of the debt. if you’re in the middle quintile, it’s just a little more than 13 months. oh. and no eating or cable tv while you’re at it.
the other issue i’d like to weave into this cloth is something i’ve mentioned here a couple times – the maldistribution of wealth. and today, i’m going to go with the poverty spin. according to the census bureau, the federal poverty level for a single, working-age adult is $9,573 (in 2003), which works out to just a little less than the federal minimum wage for a full-time employee ($5.15/hr * 40 hours/week * 50 weeks/year = $10,300).
i could be wrong here, and i guess everyone knows i’ve been wrong before, but it seems to me that you can do more for the economy (which is to say, positively affect more people) at the low end of the income spectrum than you can at the high end. we can keep expanding the size of the picture to include issue after issue, but i kinda wonder what the overall economic effect might be if the bottom quintile of households could afford, for example, a new 50mpg car. i suppose there is the problem of what to do with all the old cars, but it’s just a thought really. what happens when the next 5 or 10 million americans get themselves up to the point where they can afford new durable goods?
i’d be interested in finding out, but that’s not the direction we’re headed right now – or so it seems to me.